Today the population of the United States is 332 million, according to the previous figures, it has increased. The US Census Bureau states that the population of the United States is growing at the rate of one person every 11 seconds, with one birth every 7 seconds, one death every 13 seconds, and one migrant entering the country every 31 seconds. If you want population density maps USA, then you are in the right place.
Collection the Map of Population Density U.S.A :
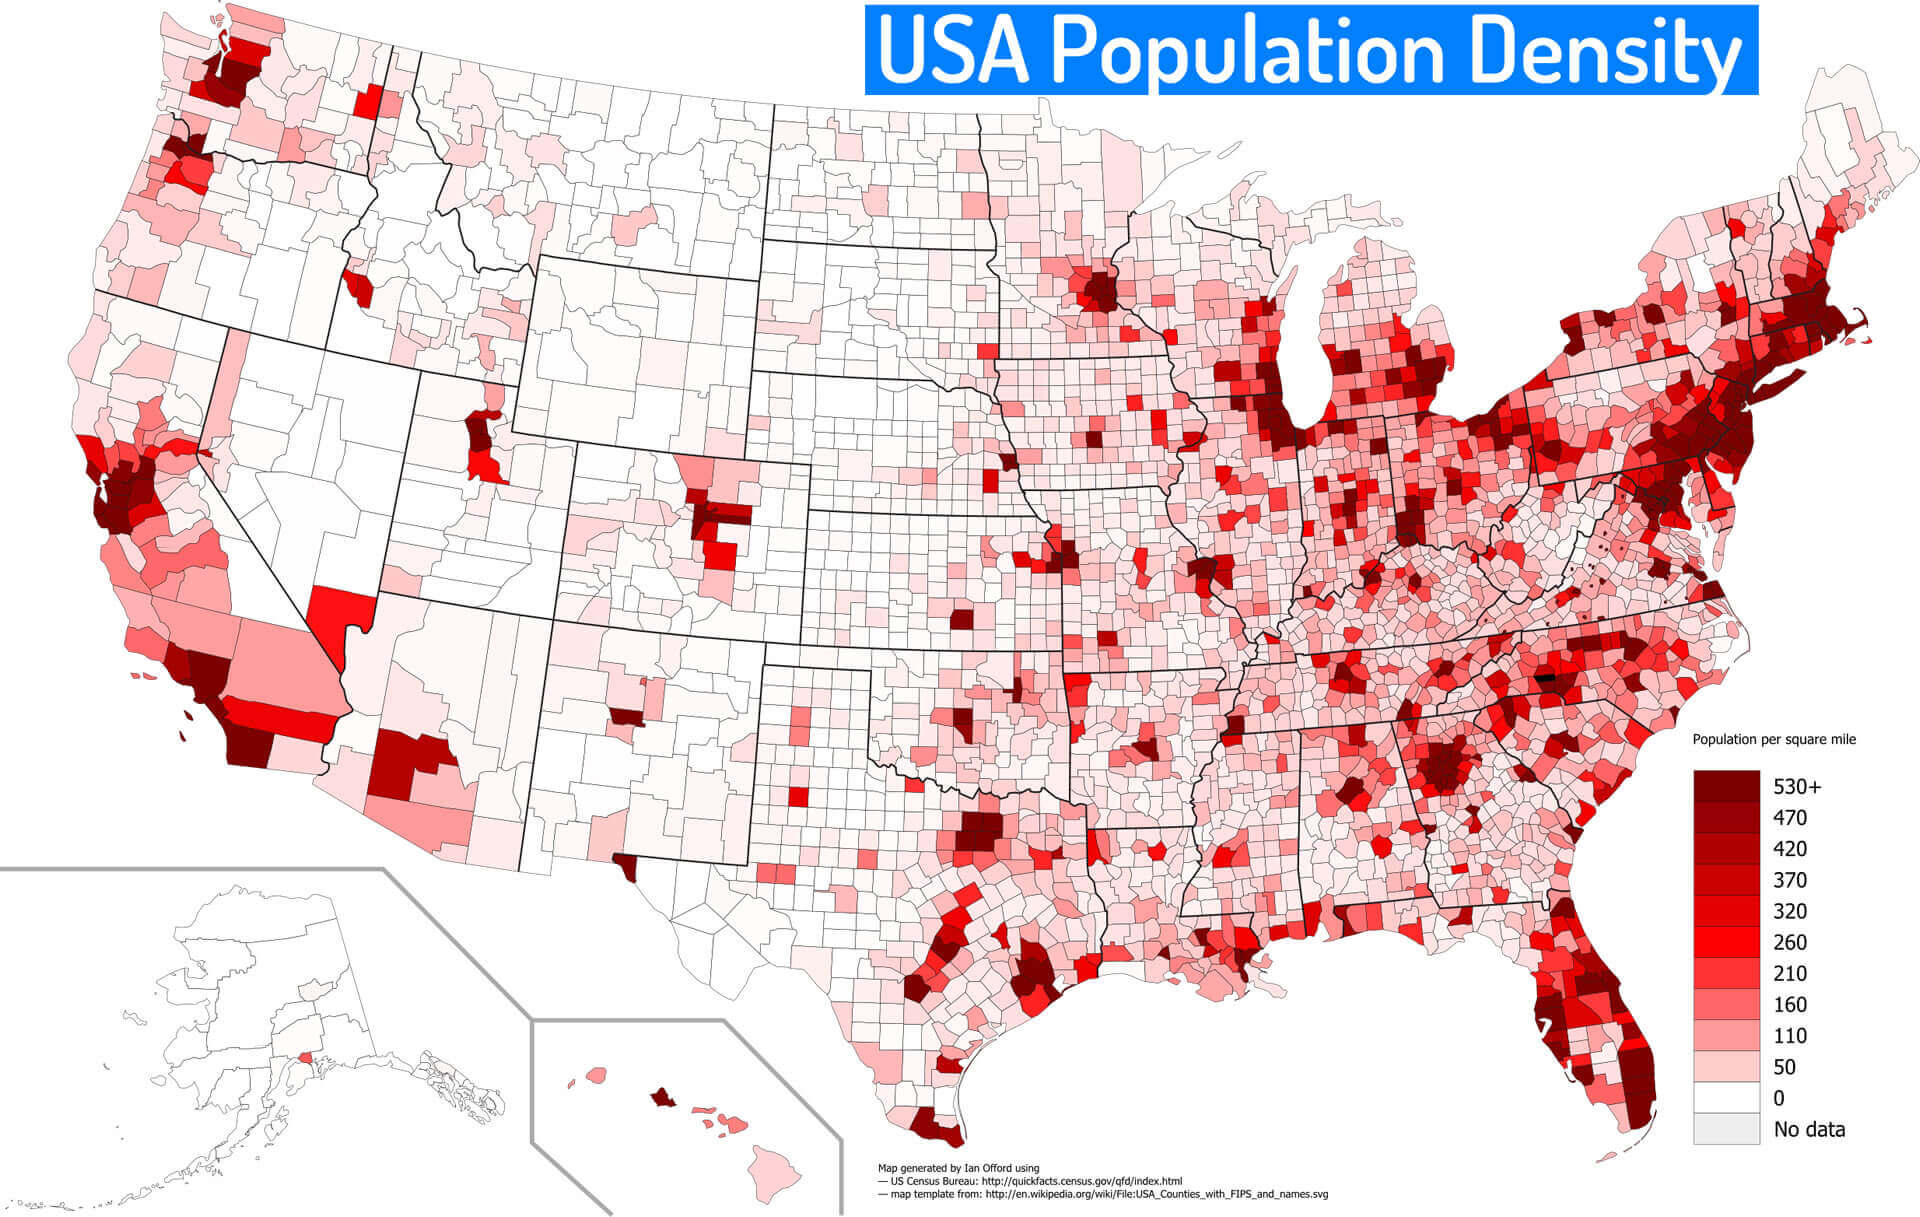
1. U.S Population density Map:
2. U.S Population density Map 2021:
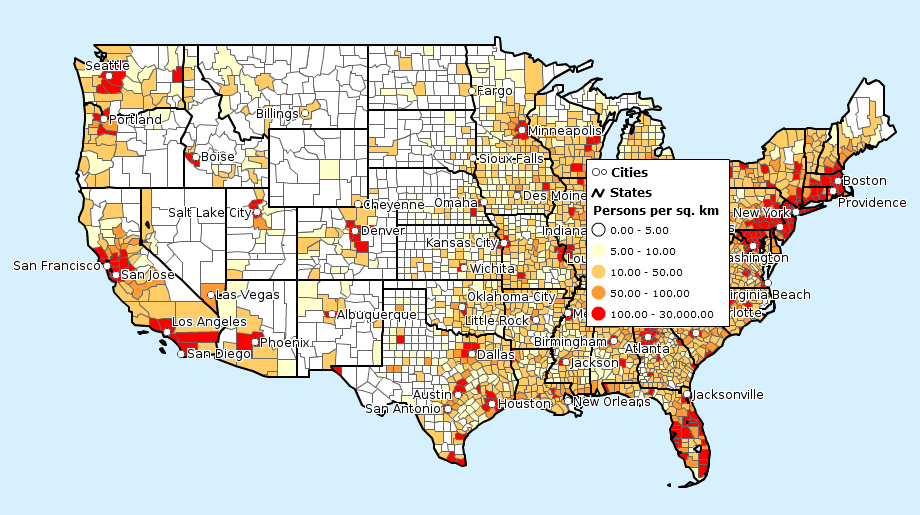
3. U.S Population density Map with Cities:

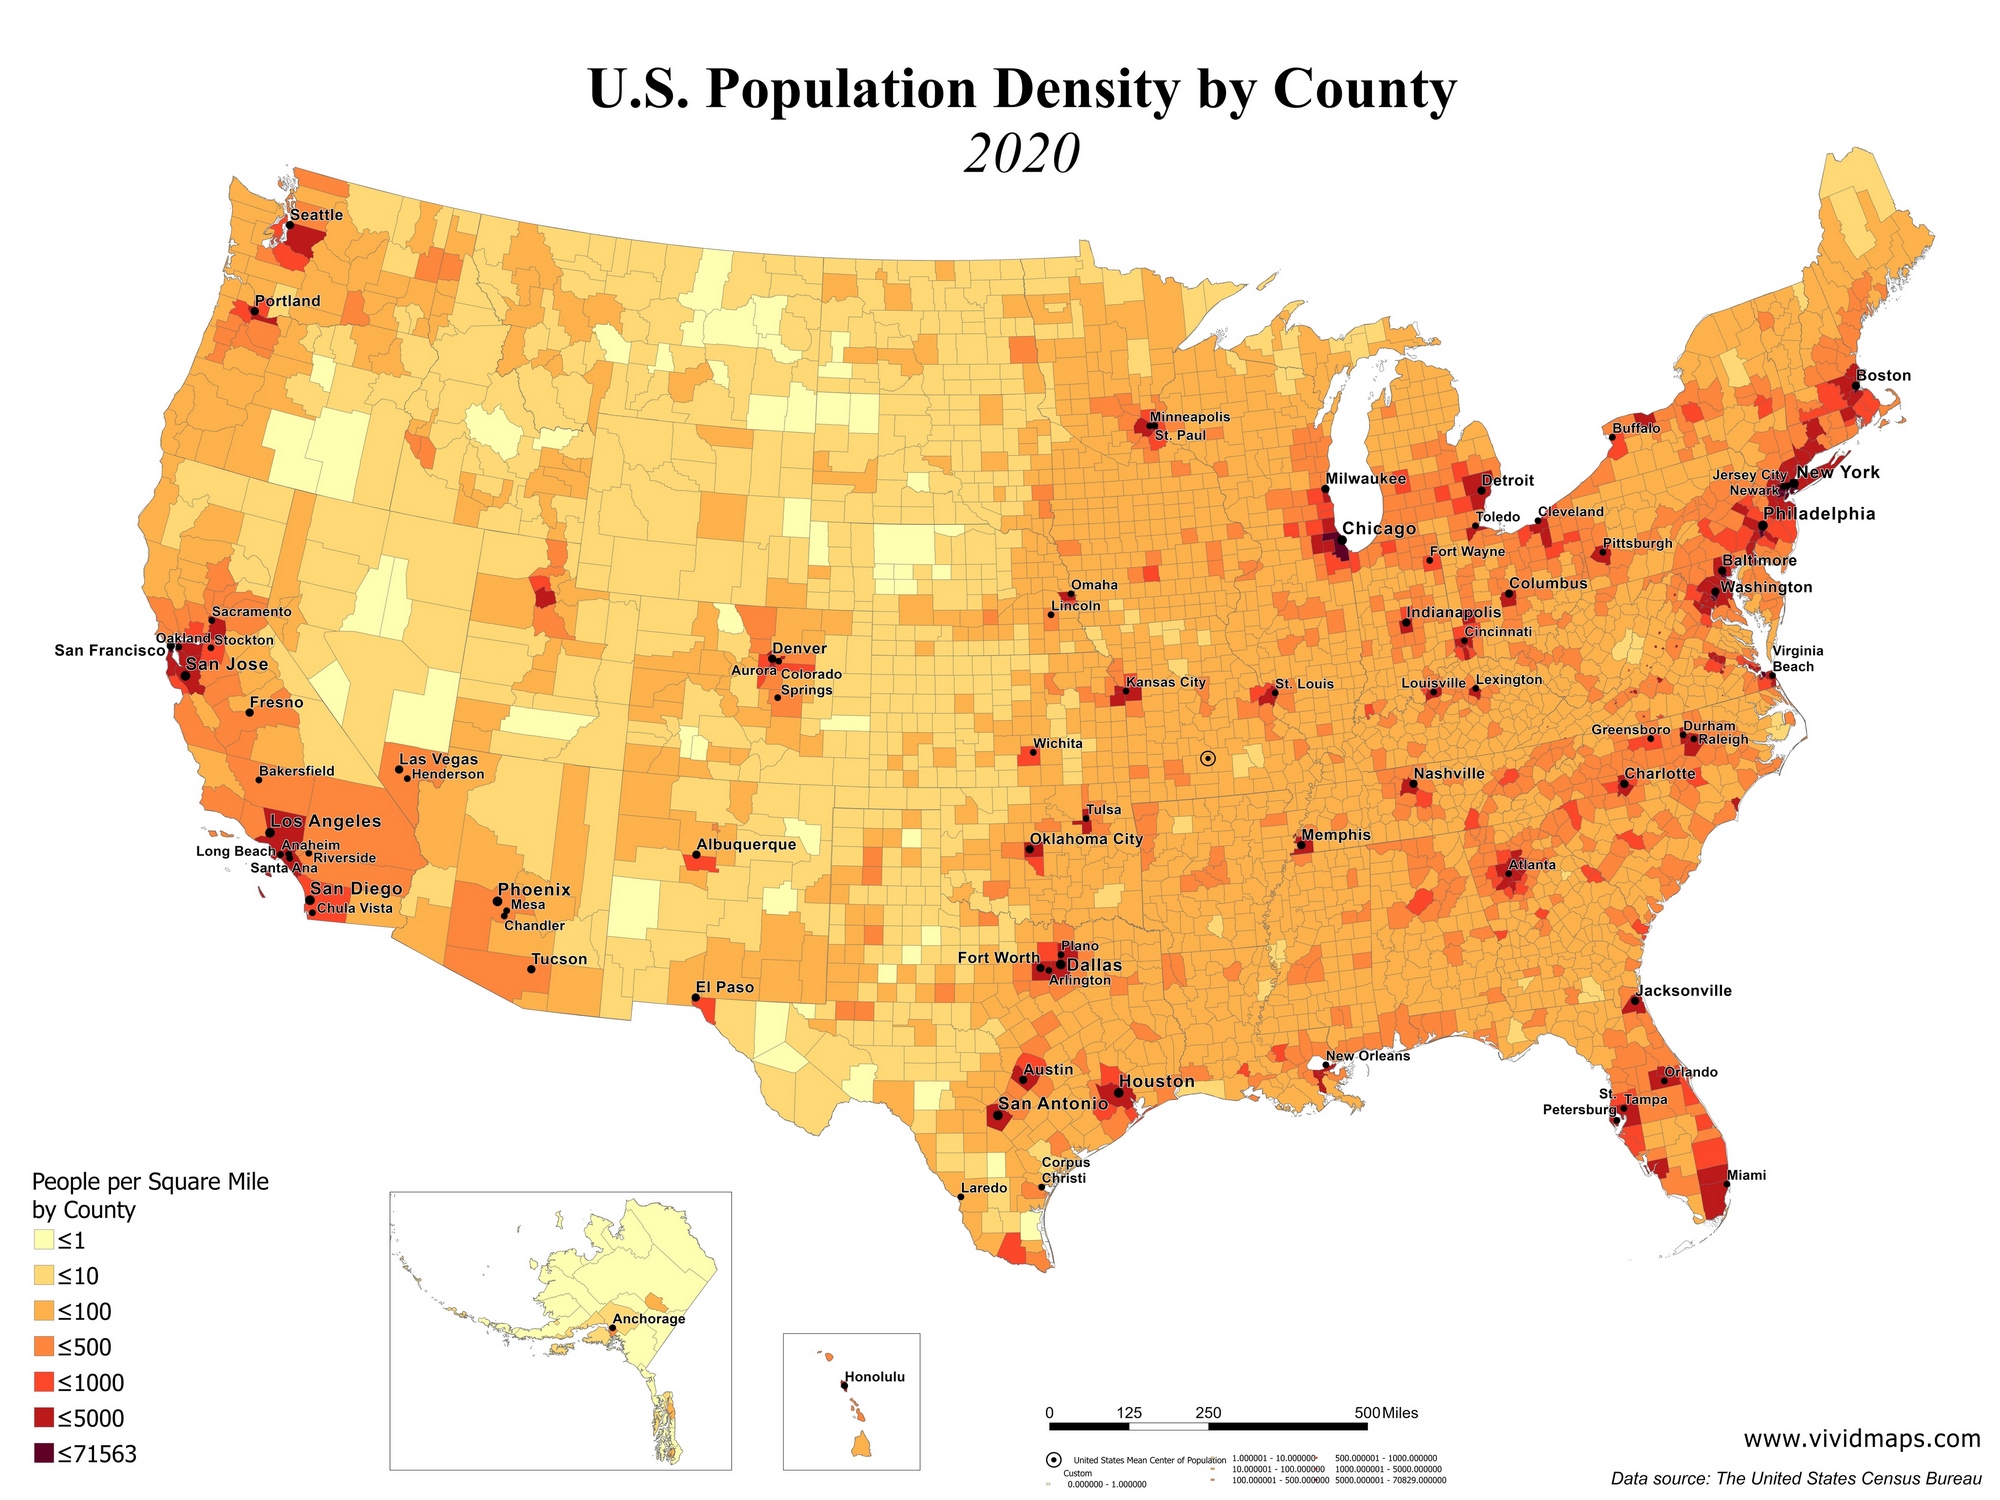
4. U.S Population density Map 2020:
5. U.S Population Growth Map:

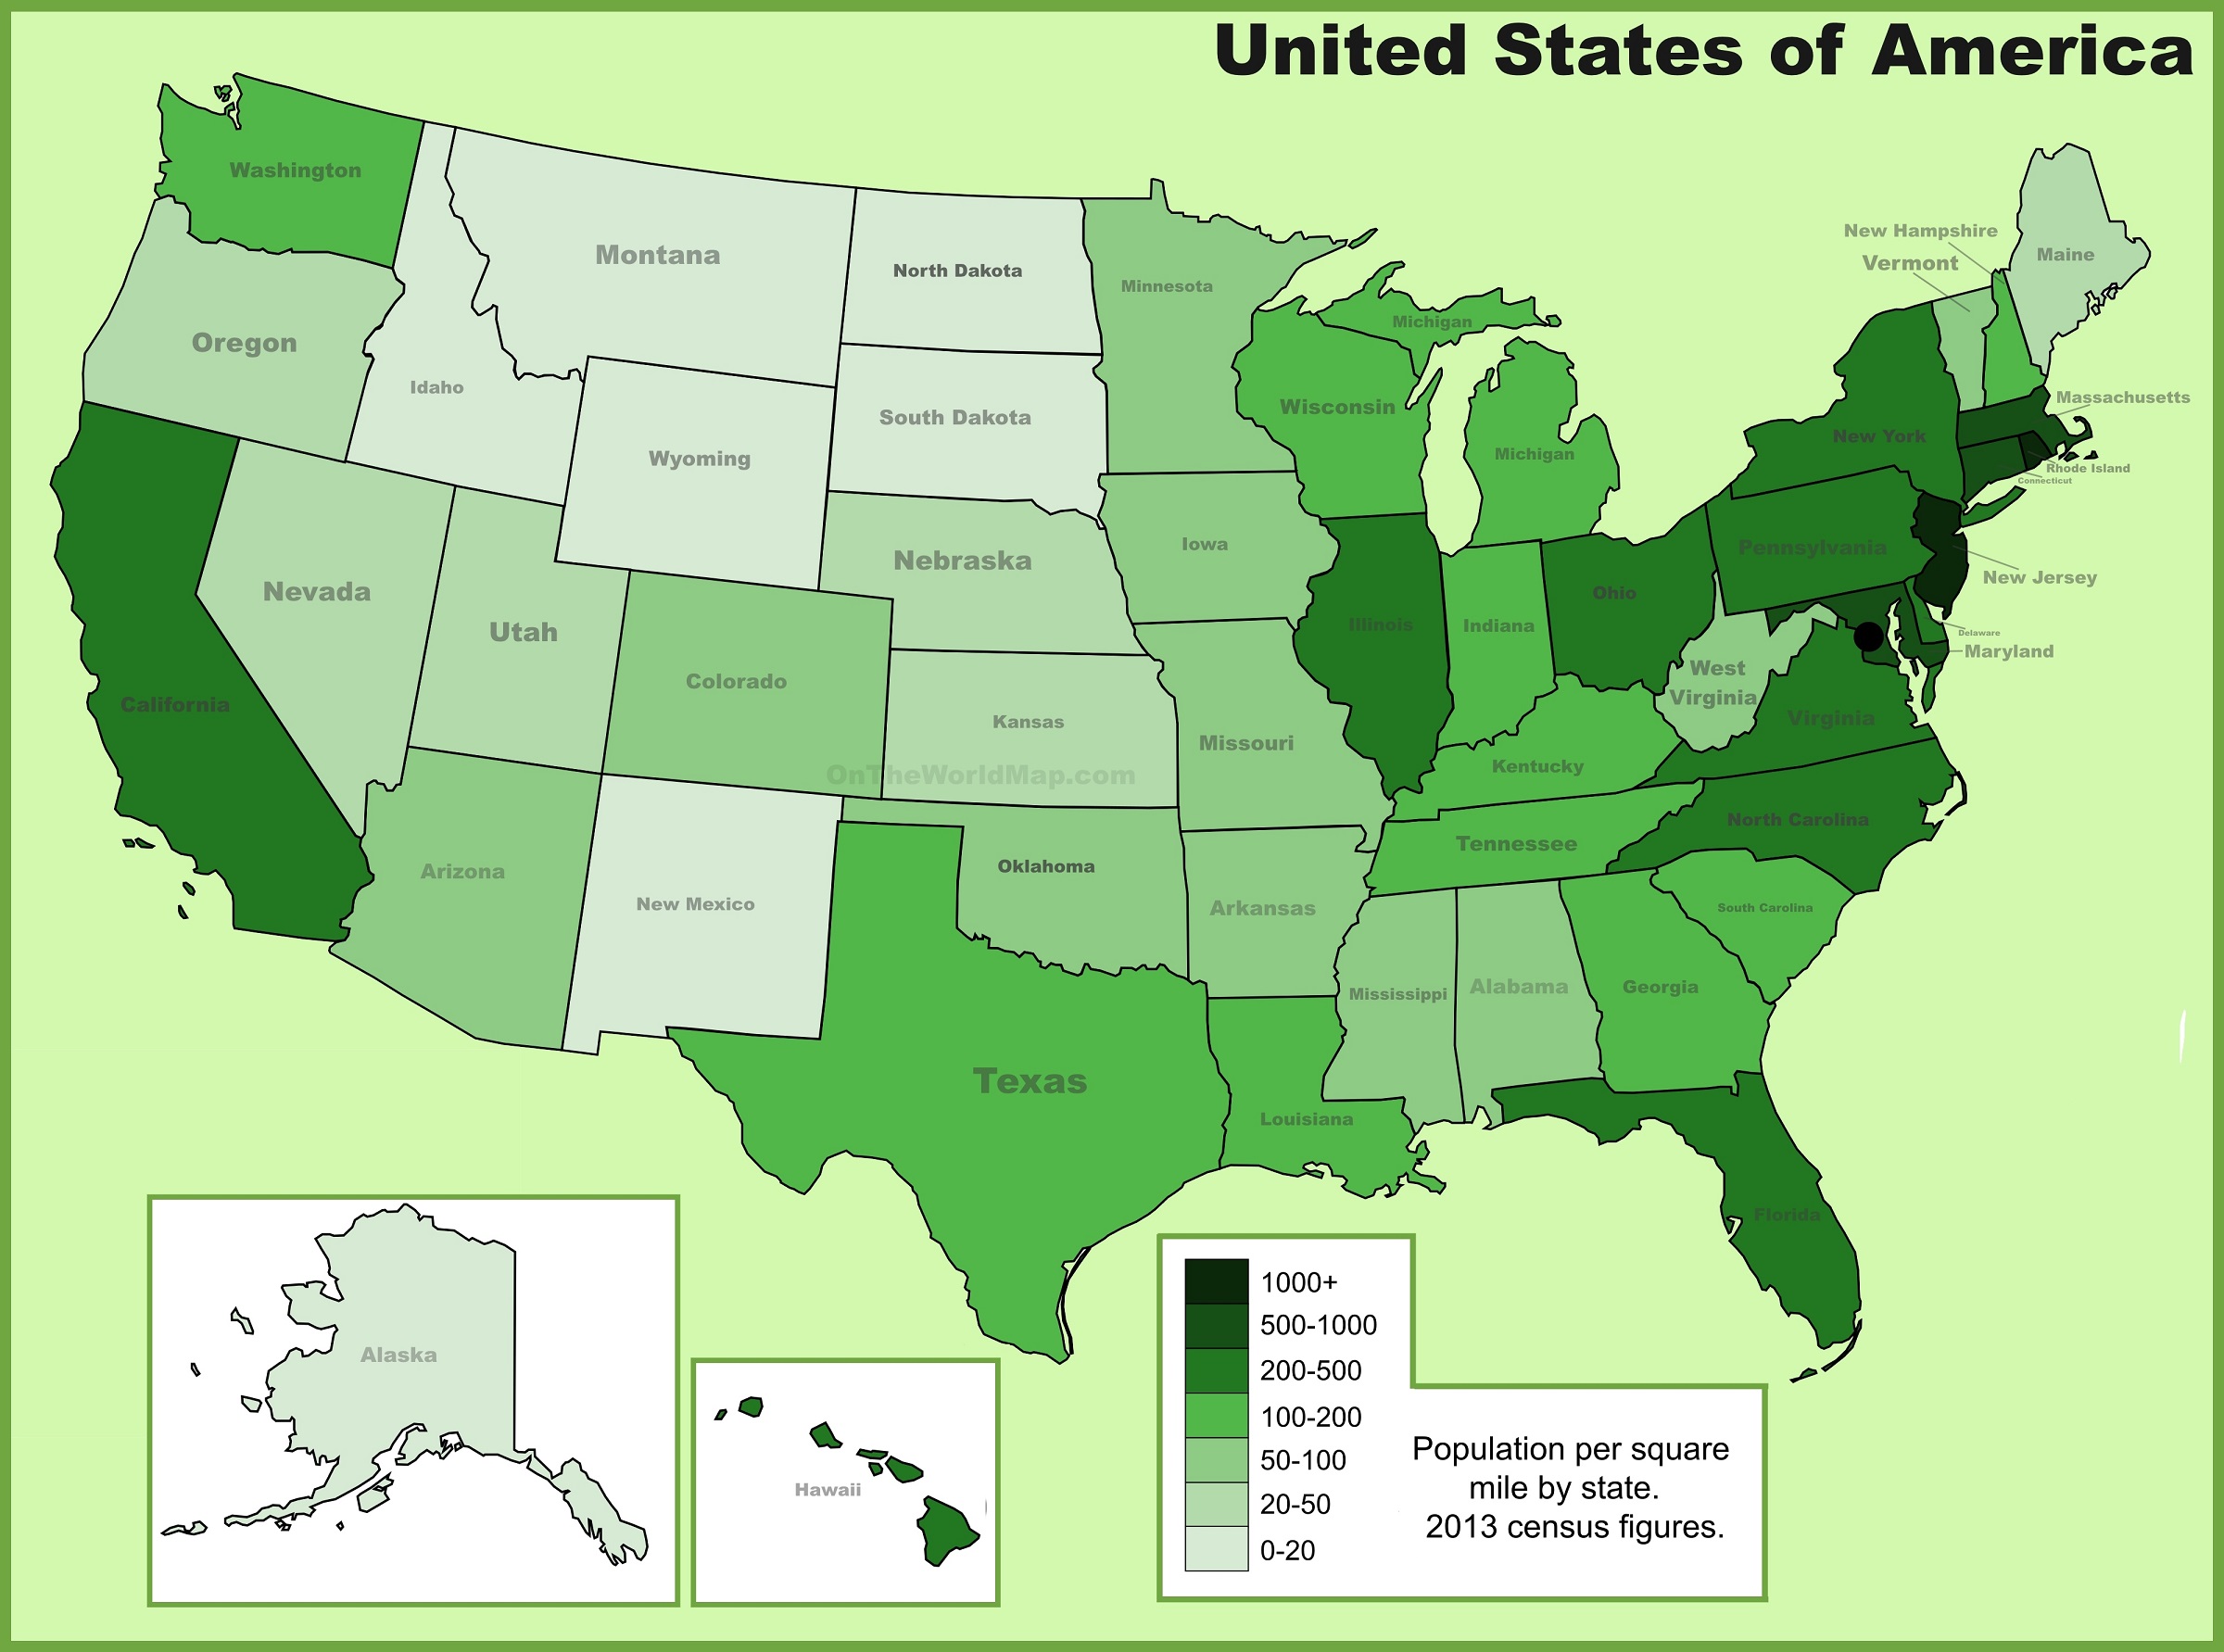
6. U.S Population density Map with State:
As we all know, the most densely populated parts of the United States are east of the Mississippi River. Population density maps show the major urban centers of New York, Philadelphia, and Washington along the East Coast. We have prepared a list of maps related to all this, in which you will get 6 types of maps. Which you can use in your project.
We know that maps of this type are mostly needed in the History project. How fast is the rate of the population increasing or decreasing? If your teacher has given you a project regarding the population density of the last year, then you can do it from the map given by us. Because we have shown 2 such maps which are on 2nd and 4th position which you can use according to your need.
U.S.A Population Data 1950 to 2021 :
Note: The table below shows historical US population data. According to the US Census Bureau, the current US population in 2024 is approximately 335 million, growing at a rate of about 0.53% per year.
| Year | Population | Growth Rate % |
|---|---|---|
| 2021 | 332,915,073 | 0.58% |
| 2020 | 331,002,651 | 0.59% |
| 2019 | 329,064,917 | 0.60% |
| 2018 | 327,096,265 | 0.62% |
| 2017 | 325,084,756 | 0.64% |
| 2016 | 323,015,995 | 0.67% |
| 2015 | 320,878,310 | 0.69% |
| 2014 | 318,673,411 | 0.72% |
| 2013 | 316,400,538 | 0.75% |
| 2012 | 314,043,885 | 0.79% |
| 2011 | 311,584,047 | 0.83% |
| 2010 | 309,011,475 | 0.88% |
| 2009 | 306,307,567 | 0.93% |
| 2008 | 303,486,012 | 0.96% |
| 2007 | 300,608,429 | 0.96% |
| 2006 | 297,758,969 | 0.94% |
| 2005 | 294,993,511 | 0.90% |
| 2004 | 292,354,658 | 0.88% |
| 2003 | 289,815,562 | 0.88% |
| 2002 | 287,279,318 | 0.94% |
| 2001 | 284,607,993 | 1.03% |
| 2000 | 281,710,909 | 1.14% |
| 1999 | 278,548,150 | 1.23% |
| 1998 | 275,175,301 | 1.27% |
| 1997 | 271,713,635 | 1.26% |
| 1996 | 268,335,003 | 1.20% |
| 1995 | 265,163,745 | 1.11% |
| 1994 | 262,241,196 | 1.04% |
| 1993 | 259,532,129 | 0.99% |
| 1992 | 256,990,613 | 0.96% |
| 1991 | 254,539,370 | 0.96% |
| 1990 | 252,120,309 | 0.96% |
| 1989 | 249,725,805 | 0.95% |
| 1988 | 247,372,264 | 0.95% |
| 1987 | 245,052,789 | 0.94% |
| 1986 | 242,763,148 | 0.94% |
| 1985 | 240,499,825 | 0.94% |
| 1984 | 238,256,844 | 0.94% |
| 1983 | 236,030,238 | 0.94% |
| 1982 | 233,821,844 | 0.94% |
| 1981 | 231,636,058 | 0.94% |
| 1980 | 229,476,354 | 0.94% |
| 1979 | 227,339,318 | 0.94% |
| 1978 | 225,223,303 | 0.94% |
| 1977 | 223,135,663 | 0.93% |
| 1976 | 221,086,429 | 0.92% |
| 1975 | 219,081,251 | 0.91% |
| 1974 | 217,114,909 | 0.90% |
| 1973 | 215,178,797 | 0.90% |
| 1972 | 213,269,802 | 0.89% |
| 1971 | 211,384,068 | 0.89% |
| 1970 | 209,513,341 | 0.89% |
| 1969 | 207,659,263 | 0.90% |
| 1968 | 205,805,754 | 0.93% |
| 1967 | 203,905,080 | 1.00% |
| 1966 | 201,895,760 | 1.08% |
| 1965 | 199,733,676 | 1.18% |
| 1964 | 197,408,505 | 1.27% |
| 1963 | 194,932,403 | 1.36% |
| 1962 | 192,313,746 | 1.45% |
| 1961 | 189,569,843 | 1.53% |
| 1960 | 186,720,571 | 1.60% |
| 1959 | 183,786,252 | 1.66% |
| 1958 | 180,788,392 | 1.71% |
| 1957 | 177,751,483 | 1.74% |
| 1956 | 174,705,003 | 1.76% |
| 1955 | 171,685,336 | 1.75% |
| 1954 | 168,736,387 | 1.70% |
| 1953 | 165,910,003 | 1.62% |
| 1952 | 163,266,028 | 1.49% |
| 1951 | 160,872,266 | 1.30% |
| 1950 | 158,804,395 | 0.00% |
Let us tell you on the basis of the old sources that the US Population densities have been monitored in the U.S. for more than 200 years, during which time, the US. The number of people living per square mile was 4.5 million in 1790 and has increased to 87.4 million in 2010. The country ranks the USA 146th in terms of population density. This particular population density map is based on a global population density map created at the Center for Socioeconomic Data and Applications at Columbia University.
Some people are also curious to know how fast the population is increasing. We have the answer to such a question because the number 5 map will solve your problem. Downloading these maps is very easy; all you have to do is print or download the maps by clicking on the PDF button. You don’t need to pay anything for this.
Frequently Asked Questions (FAQ)
Q1: What is the population density of the USA?
The United States has an average population density of approximately 94 people per square mile (36 per square kilometer) as of 2024. However, this varies greatly by state — from 1,263 per sq mi in New Jersey to just 1.3 per sq mi in Alaska.
Q2: Which is the most densely populated state in the USA?
New Jersey is the most densely populated US state, with approximately 1,263 people per square mile, followed by Rhode Island and Massachusetts.
Q3: Which is the least densely populated state?
Alaska is the least densely populated US state, with only about 1.3 people per square mile due to its vast wilderness and extreme climate.
Q4: Where do most Americans live?
Most Americans live east of the Mississippi River, particularly in the Northeast Corridor between Boston and Washington, D.C., which is the most densely populated region in the country.